If everyone in Manhattan who hailed a taxi was willing to share their ride with one stranger going the same way, how much driving would the city actually save? I dug into this for a data challenge, using 2.8 million yellow taxi trips from a single week in June 2013, and the answer turns out to be: quite a lot.
2.79M
trips processed
89%
trips matched
23.8%
vehicle miles saved
36s
average delay
The metric: VMT savings
Not all demand is poolable. Trips have to line up in space and time before sharing helps anyone. So the metric I used is Vehicle Miles Traveled (VMT) savings: take the total distance if every trip is served solo (the taxi baseline), compare it to the total distance when trips are optimally paired into shared vehicles, and measure the reduction. VMT is the thing microtransit actually promises to reduce — fuel, driver time, congestion all follow from it.
The catch is quality of service: nobody shares a ride that doubles their journey. Every pairing had to respect a maximum delay of 6 minutes per passenger and a vehicle capacity of 6 — deliberately conservative constraints.
The algorithm: shareability graphs
Fully optimising city-scale ride pooling is a variant of the Dial-a-Ride Problem, which is NP-hard and computationally hopeless at this scale. Instead I built on the shareability network idea from Santi et al. (2014): construct a graph where every trip is a node and an edge connects two trips if they can feasibly share one vehicle (checking all four pickup/dropoff orderings against the delay constraint). Each edge is weighted by the miles saved, then a maximum-weight matching picks the best set of disjoint pairs.
To make this run on millions of trips, I added vectorized pruning (temporal, capacity and geographic filters before feasibility checks), then partitioned the giant graph components with Louvain community detection so the matching solver only ever sees ~10k-node subproblems. Shortest-path distances and travel times on the OSM road network are precomputed once and cached.
What the week of data says
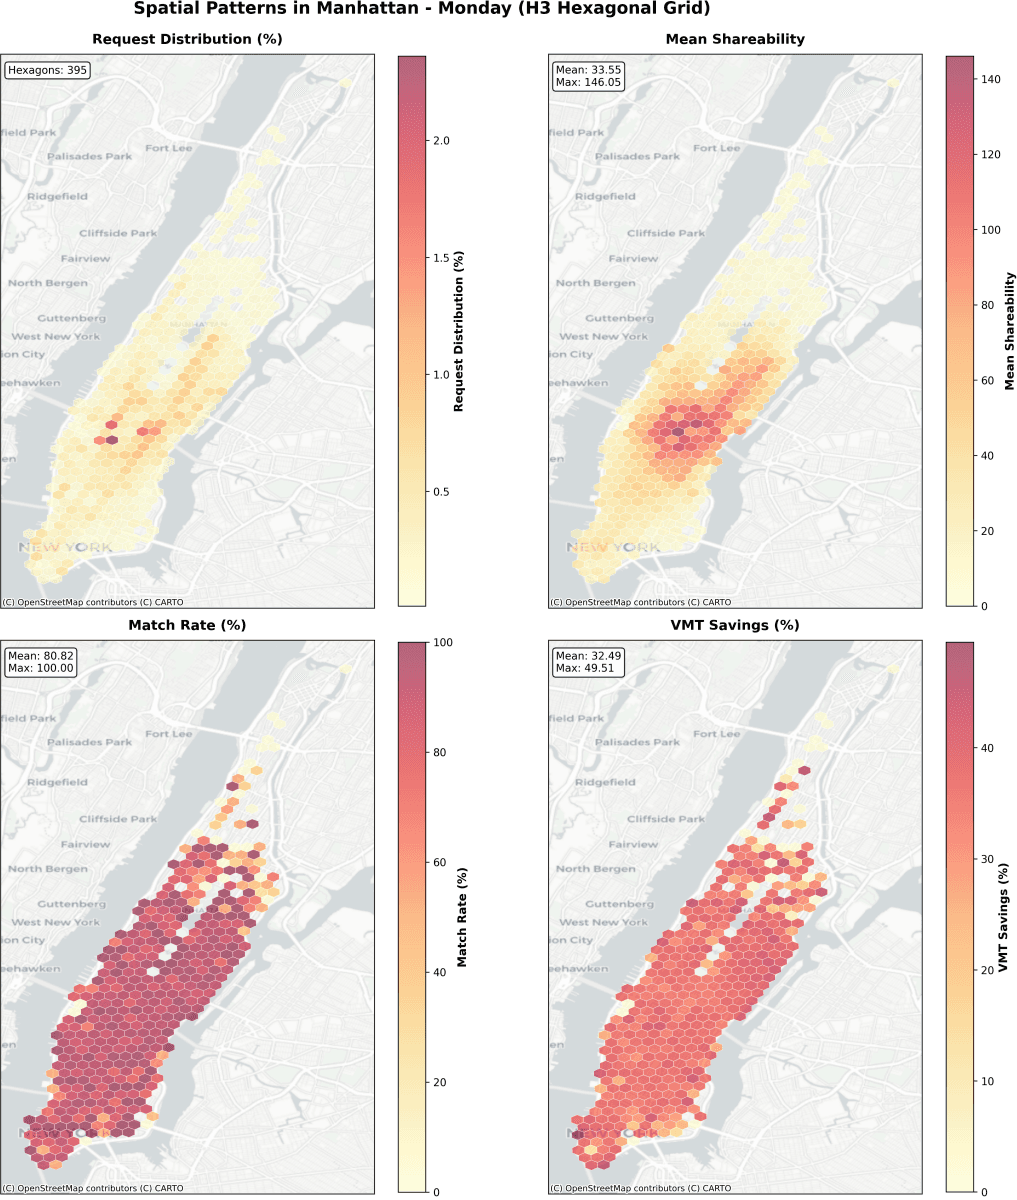
With those conservative constraints, pairwise pooling alone saves 23.76% of vehicle miles — about 2.8 million km in one week — while matching 89% of trips with an average detour of only 36 seconds. Pooling potential closely follows commuting structure:
- Weekdays beat weekends: regular commutes are similar to each other, so match rates (~66% hourly) and savings (~24%) peak on workdays.
- Mornings are the most shareable time of day — everyone travels to work at roughly the same time, but leaves at scattered times in the evening.
- Central Manhattan corridors have the densest shareability; peripheral and late-night demand is dispersed and much harder to pool.
- Interestingly, there's a threshold effect: beyond a certain graph connectivity, more shareable options don't add much VMT saving — though for a real-time service that redundancy would make dispatch far more robust.
Caveats
This is an offline analysis with full knowledge of demand, unconstrained fleet size, constant 30km/h travel speed and instant boarding — so it's an upper bound on pairwise pooling, not a service simulation. Dead mileage (taxis cruising empty, which was estimated at over half of NYC taxi hours) is out of scope too. Extending the matching beyond pairs, simulating a fixed fleet, and softening the geographic pruning are the obvious next steps.
The full write-up, with the maths, complexity analysis and the temporal/spatial visualisations, is here: read the full report (PDF).